SepEx: Visual Analysis of Class Separation Measures

EuroVA 2020 (to appear), co-located with EuroVis and EuroGraphics

Abstract | Paper | Video Presentation | Figures | Data | Open Source | Supplemental Material
SepEx on OSF.io

Abstract

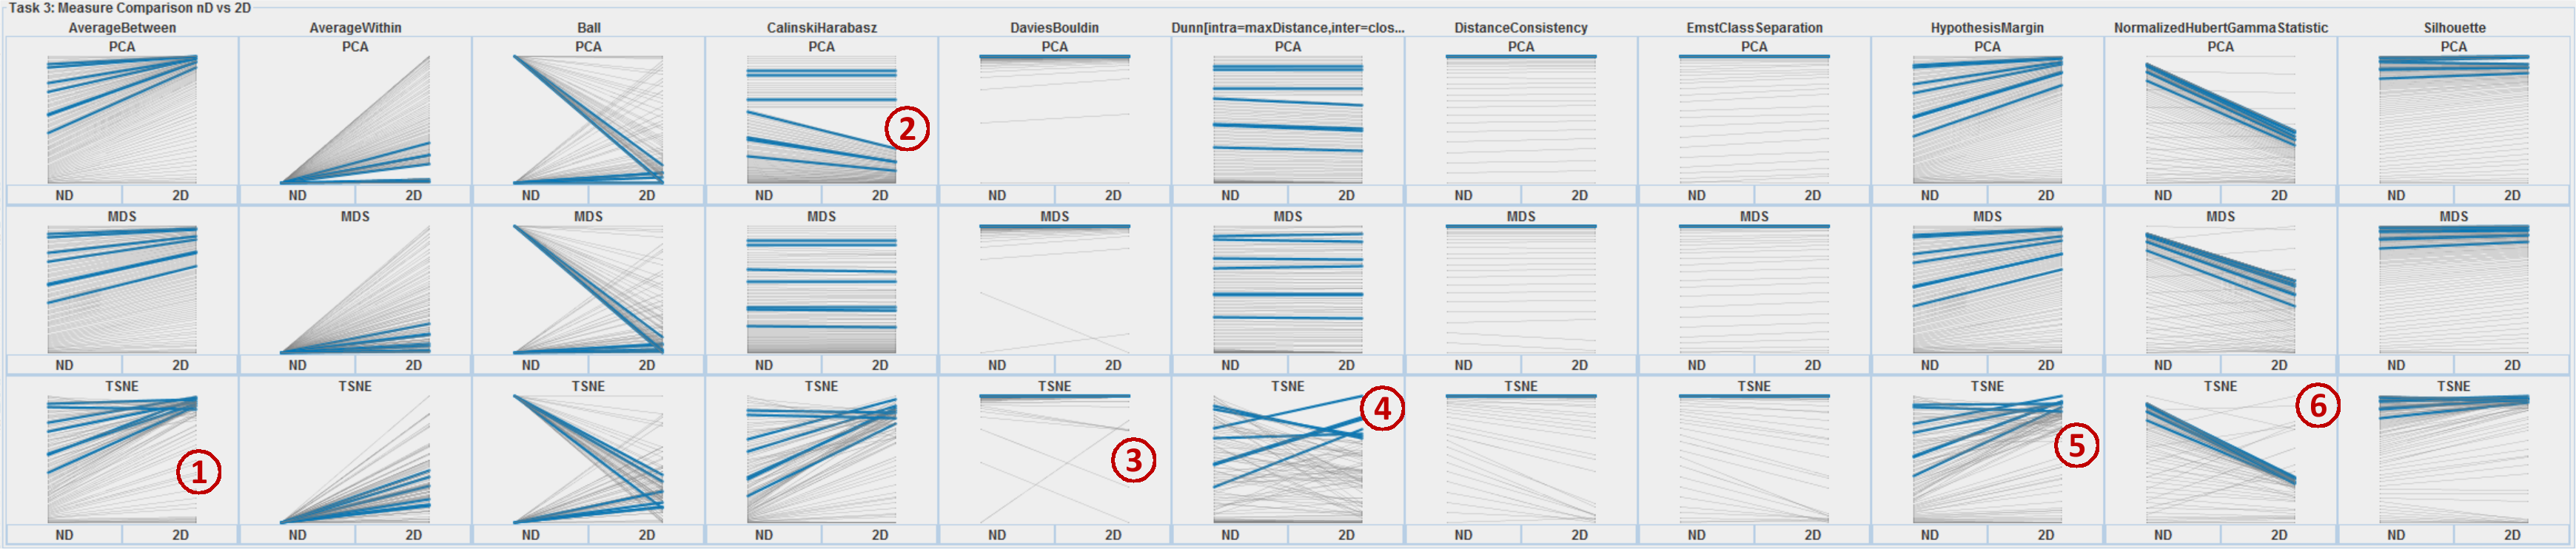
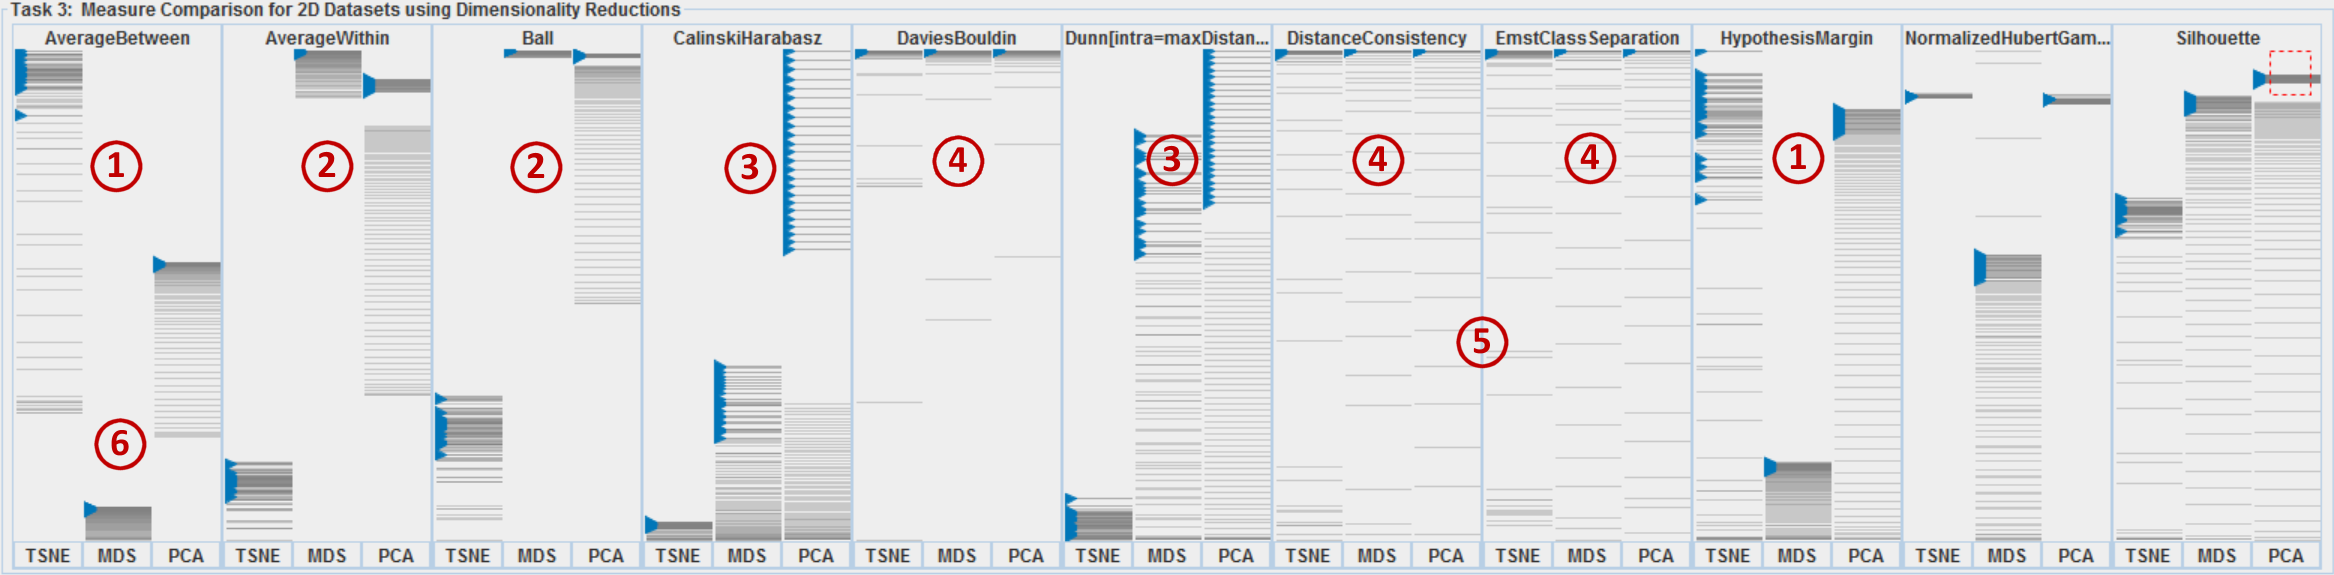
Class separation is an important concept in machine learning and visual analytics. However, the comparison of class separation for datasets with varying dimensionality is non-trivial, given a) the various possible structural characteristics of datasets and b) the plethora of separation measures that exist. Building upon recent findings in visualization research about the qualitative and quantitative evaluation of class separation for 2D dimensionally reduced data using scatterplots, this research addresses the visual analysis of class separation measures for high-dimensional data. We present SepEx, an interactive visualization approach for the assessment and comparison of class separation measures for multiple datasets. SepEx supports analysts with the comparison of multiple separation measures over many high-dimensional datasets, the effect of dimensionality reduction on measure outputs by supporting nD to 2D comparison, and the comparison of the effect of different dimensionality reduction methods on measure outputs. We demonstrate SepEx in a scenario on 100 two-class 5D datasets with a linearly increasing amount of separation between the classes, illustrating both similarities and nonlinearities across 11 measures.

Paper


Video Presentation

We demonstrate SepEx in a 13-minute video presentation, as presented at the EuroVA 2020 (virtual conference due to COVID-19).

Figures

Figure 1. Scatterplot matrices showing 3 out of 100 5D datasets with two classes (blue and red). Overall, these 100 synthetic datasets, discussed in our usage scenario, differ linearly by the de-gree of class separation, from total overlap to well-separated.
Figure 2. T1: Parallel coordinates visualization used for the visual comparison of measure outputs across datasets. Each measure defines one axis, scores of datasets are represented as grey lines (blue when selected). The 100 datasets used in the usage scenario differ in a linear increase of class separation (cf. Figure 1). We analyze 11 measures and identify interesting behaviors: 7 measures asses high separability with high values, 3 with low values (Average Within, Davies Bouldin, and Normalized Hubert), Ball is binary. Average Between, Callinski Harabasz, Dunn, and Hypothesis Margin reflect the linearity of the controlled dataset very well. In contrast, Davis Bouldin, Distance Consistency, Emst Class Separation, and Silhouette show a non-linear behavior. Most measures preserve the order, except Ball and Normalized Hubert. Finally, the value domains of the measure outputs differ considerably. Distance Consistency and Silhuette are bound to [0..1], whereas some measures are open in one direction, some with very high values such as Callinski Harabasz or Normalized Hubert.

Figure 3. T2: Comparison of pairs of measure outputs applied on nD data (left vertical axis) and DR-reduced 2D data (right vertical axis) using slope charts. 11 measures are aligned horizontally, 3 DR results in vertical direction (PCA, MDS, TSNE). Some interesting findings include: 1) For the Average Between measure, TSNE is inconsistent compared to PCA and MDS as it has larger slopes. 2) The PCA-based output shows an anomaly; after a detailed investigation, we found out that in WEKA’s PCA implementation, the 2D PCA only returns one principal component at some point, when the remaining variance is approaching zero. 3) & 4) For Davies Bouldin and Dunn, TSNE has some rank differences and is thus rather inconsistent. The datasets of finding 4) have been highlighted by selection. 5) Again, TSNE has more slopes and rank changes than PCA and MDS. 6) Hubert Statistics has an interesting diagonal pattern across all three DRs. The projections seem to compress its value range but it remains mostly consistent.

Figure 4. T3: Strip plots for the visual comparison of 11 measures, each applied on 3 different DR-reduced datasets (PCA, MDS, TSNE). For both comparisons between measures as well as within measures (between DRs), we identify considerable differences. Some groups of measures with similar output patterns stand out: 1) [Average Between, Hypothesis Margin], 2) [Average Within, Ball], 3) [Calinski Habersz, Dunn], as well as 4) [Distance Consistency, Emst Class Separation, Davis Bouldin]. Focusing on the comparison of DR outputs reveals considerable differences as well. 5) Only for Distance Consistency and Emst Class Separation the DR results are similar. 6) An unexpected finding is how strongly measure outputs differ for different DRs: using Average Between as an example, TSNE yields average to high separability, all PCA-based results achieve medium separability. In contrast, Average Between assesses MDS results hardly separable. Finally, we select the most separated datasets according to the PCA-anomaly (cf. T2 in Figure 3) by using rectangle selection in the Silhouette measure at the upper right. It can be observed how differently this PCA-specific characteristics is reflected across the 11 measures.

Data

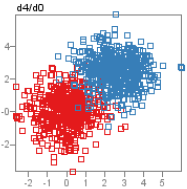
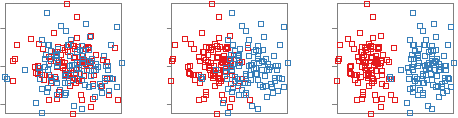
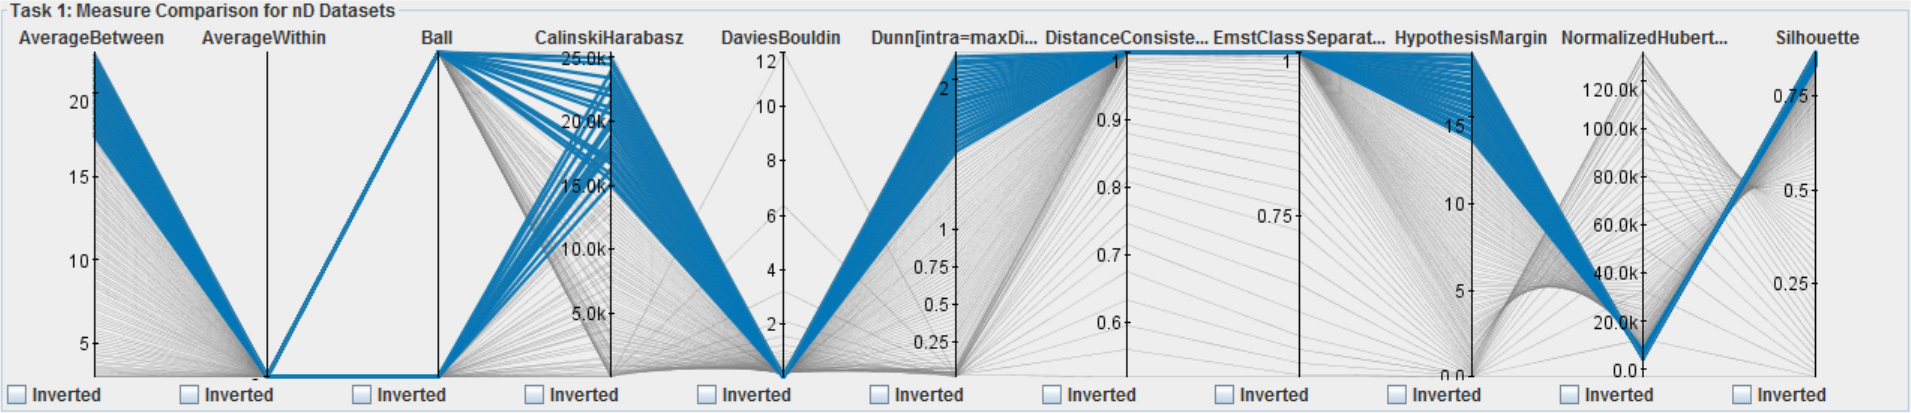
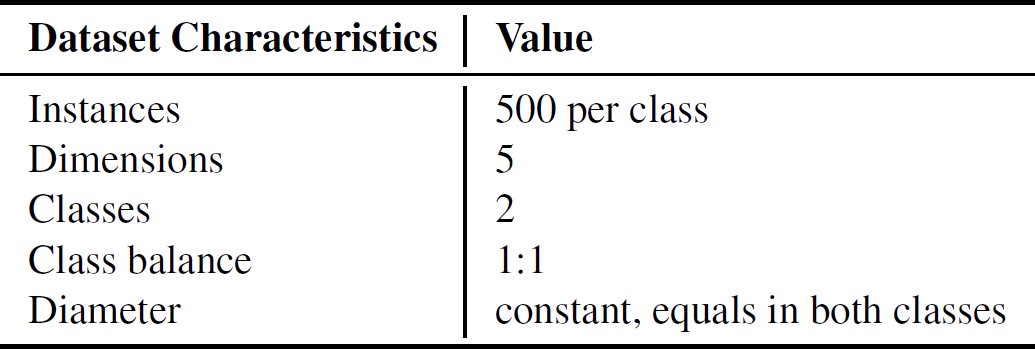
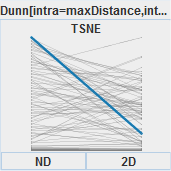
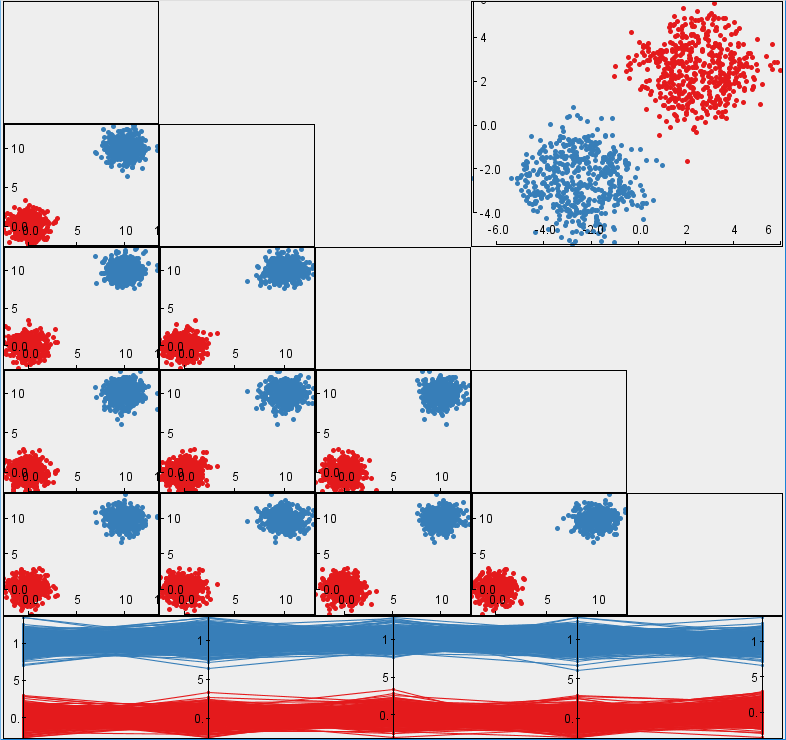
We demonstrate how SepEx can be used in a sensitivity analysis scenario. Our goals thereby are to validate SepEx by primarily studying measure characteristics, and excluding effects stemming from (uncontrolled) dataset characteristics (see future work). Therefore, we employ 100 synthetic datasets, all with 5 dimensions, 1000 instances, and two classes. The datasets differ by their class separation from overplotted to separated (cf. Figure 1, more details in the supplemental material). We analyze how consistent the estimates of 11 separation measures are for the differently separated datasets. The results of 3 DR methods further allow the analysis of consistency between nD and 2D data representations, followed the visual analysis of 11 measures applied on the different DR-reduced 2D datasets.
Animation 1. Animation of the 100 datasets showing the linear transition of the two classes from being overplotted to entirely separated (finally, the distance between the class centers of gravity is multiple times higher than the diameters of the two classes).
In Figure 19 and Figure 22, we analyze inconsistencies of the TSNE projection in detail. In Figure 19, we compare separation measure results of the nD datasets with measure results of 2D TSNE data representations (measure: Dunn's Index). Across the 100 datasets, we observe several slopes and line crossings (rank violations) across measures. These can be explained by the non-linearity of TSNE, its non-deterministic nature (randomizations), and the tendency to carve out cluster structures. In Figure 22, we take a closer look to one of the datasets ("Process100", the dataset with the highest class separation). In the figure the 5D dataset is shown using a scatterplot matrix and a parallel coordinates visualization. the TSNE-based 2D representation of the dataset is shown in a scatterplot on the upper right.

Table 1 (supplemental materials). Parameters for the synthesis of datasets for the usage scenario. These parameters were kept constant for all 100 datasets.
Figure 19 (supplemental materials). Rank preservation of the 100 datasets between the high-dimensional datasets and the 2D representations using the Dunn measure and TSNE: we identify some inconsistencies regarding rank preservation..
Figure 22 (supplemental materials). Detailed analysis of dataset “Process100”. A scatterplot matrix (main diagonal left away) and a parallel coordinates plot are showing the original 5D dataset. At the upper right a TSNE-based 2D representation is shown using a scatterplot. It can be seen that TSNE arranges the two classes right next to each other.

Open Source

We are planning to extend the SepEx approach and publish an extended version in a Journal. Along these lines, we also aim at providing an executable prototype to enable users assess separation measures by themselves. So far, we list the primary open source libraries used to build SepEx:
  • Complex Data Object - a data science library for multivariate data
  • DMandMD - a data mining and machine learning library for multivariate data
  • infoVis - a information visualization library

Supplemental Material

In the three sections of the supplemental materials document, we extend the degree to which details could be given in the manuscript. The first section describes all characteristics of the set of datasets that was used in the usage scenario. To do so, we also included additional figures showing sample datasets in detail. The second section shows screenshots of the entire system for every state and interface (cut) which made it into the paper. With this additional context (multiple linked views), we also add more findings we made during analyses. The third section provides details about the analysis of TSNE inconsistencies, including figures of selected datasets which have been dimensionality-reduced.
Last modified: Feb 05, 2021