
Jürgen Bernard
Assistant Professor (non-tenure) ofComputer Science at University of Zurich
Interactive Visual Data Analysis Group

|
About
My research focuses on the characterization, design, and evaluation of interactive visual data analysis, explainable machine learning, and human-centered AI interfaces.
I study how the strengths of humans and algorithms can be combined in human-in-the-loop approaches, to support data-centric information seeking and decision making.
My data-centered focus is on time series data and mixed multivariate data.
My technique focus ranges from unsupervised to supervised machine learning including cluster analysis, dimensionality reduction, active learning, regression analysis, classification, as well as ranking and recommendation.
From a task perspective, much of my work enables people to explore undiscovered complex data for insight and hypothesis generation.
I'm also interested in enabling people to express their knowledge and preferences through interactive feedback, and labeling, e.g., to engage with personalised and interactive machine learning environments.
Important application domains include digital libraries and digital humanities, as well as healthcare, digital health, and personal health.
Short Bio Jürgen Bernard is an Assistant Professor of Computer Science at the University of Zurich (UZH), Switzerland, and associated with the Digital Society Initiative (DSI), Zurich. He is leading the Interactive Visual Data Analysis (IVDA) Group. Jürgen Bernard studied Computer Science with focus on Computer Graphics at the University of Technology of Darmstadt. His diploma thesis in 2009 was on visual-interactive cluster analysis using neural networks. He received his PhD Degree in 2015 on “Exploratory Search in Time-Oriented Primary Data”, when he was with Fraunhofer IGD. In 2016, Jürgen Bernard started as a Post-doc researcher at TU Darmstadt at Interactive Graphics Systems Group, leading the Visual-Interactive Machine Learning Group. In 2019, Jürgen Bernard became a postdoctoral research fellow at the University of British Columbia, Vancouver, Canada, where he joined the InfoVis group, led by Professor Tamara Munzner. For his contributions in visualization research, Jürgen was recently awarded the EuroVis Young Researcher Award (2021) and the Eurographics Young Researcher Award (2022). Index Terms Visual Analytics, Information Visualization, Interactive Machine Learning, Human-Centered AI, Responsible AI, Explainable AI, Personalized Analytics, Preference Elicitation, Human-Computer Interaction, Data Science, Time Series Analysis, Exploratory Search, Active Learning, Interactive Data Labeling, Visual Cluster Analysis, Dimensionality Reduction, Multivariate Data Analysis, Mixed Data Analysis, Digital Libraries, Digital Humanities, Healthcare, Digital and Personal Health. |
News
 | Honorable Mention Award at VMV 2025 Vision, Modeling, and Visualization Conference 2025 | 2025-10-01 We were awarded the honorable mention best paper award for Val-LLM, one of the first VA approaches for the critical validation of LLM-generated tabular data — designed, developed, and evaluated by our IVDA team members Madhav Sachdeva, Christopher Narayanan, Marvin Wiedenkeller, Jana Sedlakova, and myself. Val-LLM introduces new human–AI collaboration principles, human knowledge externalization, multi-granularity validation, and workflow integration to the validation process. |
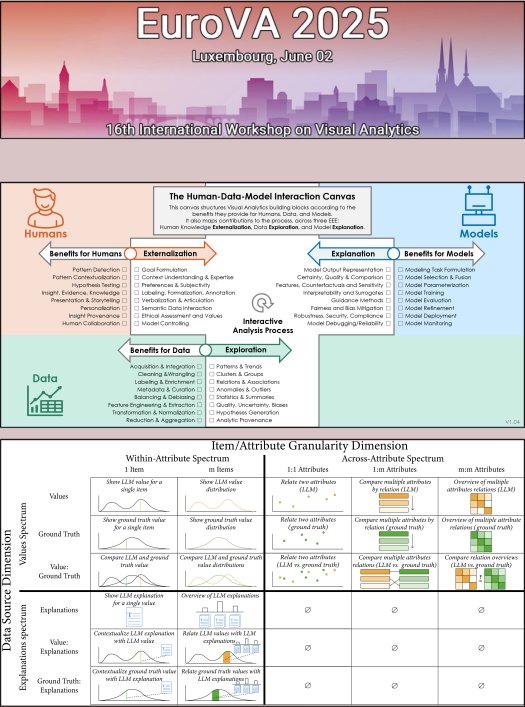 | Best Paper at EuroVA 2025 EuroVA @ EuroVis Conference 2025 | 2025-06-02 We have two papers at EuroVA 2025, one will receive the best paper award! It is a design space for the critical validation of LLM-Generated data, with Madhav Sachdeva, Christopher Narayanan, Marvin Wiedenkeller, and Jana Sedlakova. I'm presenting "The Human-Data-Model Interaction Canvas", that structures VA building blocks by benefits they provide for Humans, Data, and Models, and their contributions to the process: Human Knowledge Externalization, Data Exploration, and Model Explanation. |
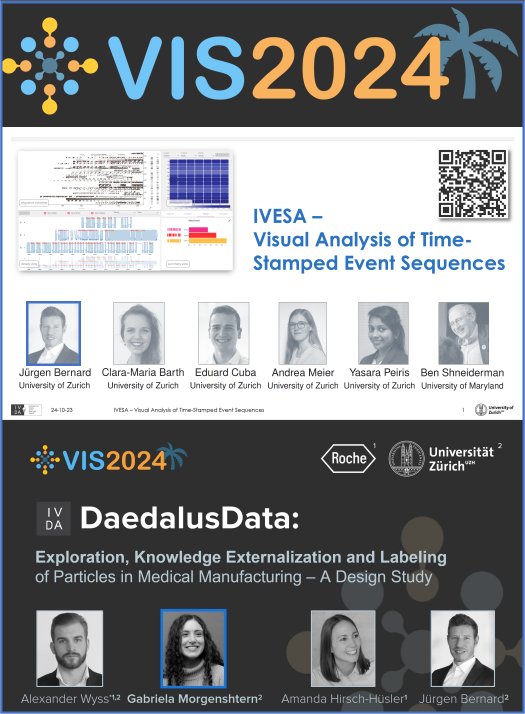 | Three Papers at IEEE VIS IEEE VIS Conference 2024 | 2024-10-14 Happy that my Ph.D. student Gabriela presents the TVCG paper "DaedalusData: Exploration, Knowledge Externalization and Labeling of Particles in Medical Manufacturing". I present the TVCG paper "IVESA – Visual Analysis of Time-Stamped Event Sequences, a collaborative work with four IVDA students and Prof. Ben Shneiderman. We also have a workshop paper on "Visualization and Automation in Data Science: Exploring the Paradox of Humans-in-the-Loop", presented by Jen Rogers. |
 | Organizer of BELIV 2024 (save the date) IEEE VIS Workshop on research methods in visualization | 2024-10-13 I will be co-organizing the 10th BELIV Workshop, the international forum to broadly discuss research methods in visualization. Our discussions span from novel design and evaluation methods for visualization tools and techniques, to methods that more generally establish the validity and scope of acquired visualization knowledge. BELIV supports contributions from the rich spectrum of visualization researchers, embracing the varied ways that they self-identify with respect to the main conference areas at VIS. |
 | SNF Grant on Personalized Visual Analytics, together with Prof. M. El-Assady (ETH) Personalized Visual Analytics: Human Preference Elicitation for Ranking-Based Multi-Criteria Decision Support | 2024-09-27 I have received a project grant from the Swiss National Science Foundation (SNF). The next four years, we will explore opportunities to support multi-criteria decision-making through interactive item ranking creation. Together with Mennatallah El-Assady (ETH Zurich), we will desitn, develop, and evaluate interfaces for human preference elicitation, guidance and provenance support, and uncertainty-aware decision-making for item rankings. |
 | General Chair of VAHC 2023 IEEE VIS Workshop on Visual Analytics in Healthcare | 2023-10-22 I had the pleasure to serve as the General Chair of VAHC 2023, in conjunction with IEEE VIS 2023, Oct 22 in Melbourne, Australia. VAHC is the premier research event for applications of data visualization and visual analytics in healthcare, digital health, and personal health. We bring together medical experts, leading scientists, and visionaries to discuss opportunities and challenges in using visual analytics techniques to help patients, clinicians, public health researchers, and others. |
 | EuroGraphics Young Researcher Award Jürgen Bernard has received the EuroGraphics 2022 Young Researcher Award! | 2022-04-25 In recognition of his outstanding contributions to Computer Graphics in the area of information visualization and visual analytics. In his area of research Jürgen Bernard has produced a number of outstanding contributions, which is evidenced by several best paper awards from conferences such as IEEE VIS and EuroVA, the Hugo-Geiger Preis in 2016, and the Dirk Bartz Prize in 2017. EUROGRAPHICS is pleased to recognize Jürgen Bernard with the 2022 Young Researcher Award. |
 | Best Paper Award at IEEE VIS Successful collaboration with BMW | 2021-10-26 We have received the Best Paper Award for our paper IRVINE: A Design Study on Analyzing Correlation Patterns of Electrical Engines. Co-authors are Joscha Eirich, Jakob Bonart, Dominik Jäckle, Michael Sedlmair, Ute Schmid, Kai Fischbach, Tobias Schreck, and Jürgen Bernard. IRVINE is a Visual Analytics system to detect and understand previously unknown errors in the manufacturing of electrical engines at BMW. IEEE VIS is the the premier forum for advances in visualization and visual analytics. |
Publications by Topics
Interactive Machine Learning


Explainable and Trustworthy AI


Visual-Interactive Labeling (VIAL)

Visual Analytics for Time-Oriented Data

Design Studies and Applications


Theoretical Foundations of Visualization


Experiments and Empirical Work

Visual Analytics in Health Care
Exploratory Search
Data Sets (Open Access)


Awards & Honors
| Honorable Mention Award | VMV, Erlangen, GER | ValLLM: A VA Approach for the Validation of LLM-Generated Data (VMV) | 2025 |
| Best Paper Award | EuroVA, Luxemburg, LUX | A Design Space for the Validation of LLM-Generated Tabular Data (EuroVA) | 2025 |
| UZH Semester Award | University of Zurich, Zurich, CH | Bachelor Thesis of Paul Ferdinand Safari (Superv.) (UZH) | 2024 |
| EuroGraphics Young Researcher Award | EuroGraphics, Reims, FR | For his outstanding contributions to Computer Graphics in the area of information visualization and visual analytics (Eurographics) | 2022 |
| Best Paper Award | IEEE VIS, New Orleans, USA | IRVINE: A Design Study on Analyzing Correlation Patterns (...) (TVCG) | 2021 |
| EuroVis Young Researcher Award | EuroVis, Zurich, CH | For his significant contributions to the European Visualization Community (EuroVis) | 2021 |
| Best Paper Award | EuroVA, Zurich, CH | LFPeers: Temporal Similarity Search in Covid-19 Data (EuroVA) | 2021 |
| Best Paper Award | EuroVA, Norrköping, SWE | Learning and Teaching in Co-Adaptive Guidance (...) (EuroVA) | 2020 |
| 4th most-contributing Author all Time | EuroVA, Porto, POR | 10th Anniversary of EuroVA - 8 Publications between 2010 and 2019 (EuroVA) | 2019 |
| Best Paper Award Nom. | EuroVA, Porto, POR | Visual Analysis of Degree-of-Interest Functions (...) | 2019 |
| Datenlotsen Price | TU Darmstadt, GER | Best Student Thesis of Christian Ritter (Supervision) | 2018 |
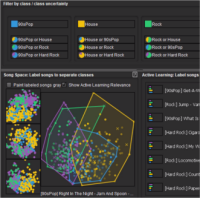
| Best Paper Award Nom. | EuroVA, Brno, CZR | Personalized Visual-Interactive Music Classification | 2018 |
| Honorable Mention for Best P. | Fraunhofer IGD, DA, GER | Comparing visual-interactive labeling with active learning (IEEE) | 2018 |
| Dirk Bartz Price | Eurographics EG, Lyon, FRA | Visual Computing in Medicine (Eurographics) | 2017 |
| Best Paper Award | IVAPP/VISGRAPP, Porto, POR | Visual-Interactive Similarity Search for Complex Objects (...) | 2017 |
| Hugo-Geiger Preis | Fraunhofer, München, GER | Excellent dissertations in the Fraunhofer society (Press Release) | 2016 |
| GI Best PhD Thesis Award Nom. | Gesellschaft für Informatik (GI), Dagstuhl, GER | Excellent Dissertations in Computer Science, candidate for TU Darmstadt (GI Dissertation Prize) | 2016 |
| Best Paper Award Nom. | EuroVA, Groningen, NED | Visual-Interactive Segmentation of Multivariate Time Series | 2016 |
| Best Industrial Project Awd. | Fraunhofer IGD, DA, GER | In collaboration with UKE Universitätsklinikum Hamburg Eppendorf | 2016 |
| Best Paper Award | Fraunhofer IGD, DA, GER | A Visual-Interactive System for Prostate Cancer (...) GC&A (Report) | 2016 |
| Dissertation | TU Darmstadt, GER | Disputation with ”summa-cum-laude“ | 2015 |
| Best Paper Award | i-KNOW, Graz, AUT | Conference on Knowledge Tech. and Data-driven Business (i-KNOW) | 2014 |
| Best Industrial Project Awd. | Fraunhofer IGD, DA, GER | In collaboration with IVA/Fraunhofer IGD and UKE, Hamburg, Germany | 2014 |
| Honorable Mention for Best P. | Fraunhofer IGD, DA, GER | Content-based layouts for exploratory metadata search (...) (Report) | 2013 |
| Best Student Paper Award | JCDL, Washington, USA | Content-based layouts for exploratory metadata search (...) (JCDL) | 2012 |
| Honorable Mention for Best P. | Fraunhofer IGD, DA, GER | A visual digital library approach for time-oriented scientific primary data | 2011 |
| Best Paper Award | Fraunhofer IGD, DA, GER | Visual Cluster Analysis of Trajectory Data With Interactive Kohonen Maps | 2010 |
| Best Diploma Thesis Awd. | Fraunhofer IGD, DA, GER | Methoden zur Qualitätsbewertung von Self-organizing Maps SOM (...) | 2010 |
Invited Talks
| Human Knowledge and Preference Externalization for IVDA | Keynote at the VizTIG Symposium, University of Leeds, UK | 2025 |
| Datenanalyse und Visualisierung | Alumni Event, WWF Faculty, UZH, Zurich, CH | 2025 |
| Decision-Making in the Age of AI: Interactive Visual Data Analytics | SIRA Brown Bag Talk, Swiss Informatics Research, CH | 2025 |
| Human Knowledge and Preference Externalization for Personalized VA | SFB TR 161, University of Stuttgart, GER | 2025 |
| Visual Analytics: Mensch und Maschine im Dialog mit Daten | Computer Graphic Night, Fraunhofer IGD, Darmstadt, GER | 2024 |
| Generative AI - Designing Interactive AI Systems | CAS Certificate of Advanced Studies, Zurich, CH | 2024 |
| Data Visualization - CAS Datenmanagement und Informationstechnologien | Certificate of Advanced Studies, UZH, CH | 2024 |
| Interactive Data Visualization with AI - Ethical and Reflective Prompt Eng. | DSI Minor Lecture Series, DSI, CH | 2024 |
| Visual Analytics in Healthcare | Monash University, Melbourne, AUS | 2023 |
| Interactive Visual Data Analysis | DSI PhD Excellence Track, DSI, CH | 2023 |
| Data Analysis - Challenges and Opportunities | Robotics and Perception Group, UZH, CH | 2022 |
| Human-Centered Data Analysis | Forschungsgruppe Financial Economics (IBF), UZH, CH | 2022 |
| Interaktion und Raum | DSI Perspektiven, UFSP Sprache und Raum, UZH, CH | 2022 |
| Interacting With Data | Inaugural Lecture, Univeristy of Zurich, CH | 2022 |
| Interactive Data Science with the Human-in-the-Loop | BMW, Bayerische Motorenwerke, Munich, GER | 2021 |
| Interactive Visual Data Analysis | University of Zurich, CH | 2020 |
| Enhancing Human Centered and Interactive Machine Learning | Aarhus University, DEN | 2019 |
| Enhancing Human-Centered Machine Learning with Visual Analytics | Visual Computing Forum, University of Bergen, NOR | 2019 |
| Enhancing Interactive Data Science with Visual Analytics | University of Rostock, GER | 2019 |
| Visual-Interactive Data Science | University of Zurich, CH | 2019 |
| Transparent Machine Learning with Visual Analytics | VIS in Practice at VIS 2018, Berlin, GER | 2018 |
| Visual-Interactive Machine Learning | TU Graz, AUT | 2018 |
| Visual-Interactive Data Science | City, University of London, UK | 2018 |
| Visual-Interactive Machine Learning | University of Konstanz, GER | 2018 |
| Interactive Visual Data Science | University of Trier, GER | 2018 |
| Data Visualization and Visual Analytics | Graduate School of Excellellence, TU Darmstadt, GER | 2018 |
| Machine Learning with the User-in-the-Loop | VRVis, Center for VR und Vis, Vienna, AUT | 2018 |
| Visual-Interactive Machine Learning for Time-Oriented Data | University of Konstanz, GER | 2018 |
| Visual Computing for Big Data Analysis in Prostate Cancer Research | Dirk Bartz Price Talk, Eurographics, Lyon, FRA | 2017 |
| Exploratory Search in Time-Oriented Data | Vienna University of Technology, Vienna, AUT | 2017 |
| Visual Analytics meets Machine Learning | St. Poelten University of Applied Sciences, St. Pölten, AUT | 2017 |
| Visual Analytics meets Human Motion Analysis | University of Bonn, Bonn, GER | 2016 |
| Explorative Suche in Zeitbasierten Primärdaten | Gesellschaft für Informatik, Award Nomin., Dagstuhl, GER | 2015 |
| Relation Seeking between Time Series Data and Multivariate Data | Conference on Artificial Intelligence (AI), Cambridge, UK | 2015 |
| Exploratory Search in Time-Oriented Primary Data | PhD Defense, University of Darmstadt, GER | 2015 |
| Visual Analysis of Time-oriented Data | British Telecom, Ipswich, UK | 2013 |
| Visual Analysis of Time-oriented Data | Conference on Artificial Intelligence (AI), Cambridge, UK | 2013 |
| Content-based vs. Metadata-based Search and Analysis | Research Worksop, University of Konstanz, GER | 2012 |
| Visual Access to Time-Oriented Scientific Primary Data | Deutsches Klimarechenzentrum (DKRZ), Hamburg, GER | 2011 |
| Visualization and Search for Time-Oriented Scientific Primary Data | DataCite, Technische Informationsbib. Hannover (TIB), GER | 2010 |
Publications by Year
Publications by Type
Theses
 |
T002 |
Exploratory search in time-oriented primary data Technische Universität Darmstadt, Dissertation, PhD Thesis (Dissertation) (2015). |
 |
|
|
|
 |
T001 |
Methoden zur Qualitätsbewertung von Self-organizing Maps zur Unterstützung des visuellen Analyseprozesses Technische Universität Darmstadt, Diploma Thesis (Diplomarbeit) (2009). |
|
|
|
|
Books
 |
B001 |
Methoden zur Qualitätsbewertung von Self-organizing Maps (SOM): Unterstützung der Visuellen Clusteranalyse AV Akademikerverlag, 978-3-639-85612-5 pp. 100 p., (2015). |
|
|
|
|
Peer-reviewed Journal Articles
 |
J040 |
f-RecX: A framework for designing effective textual explanations in recommender systems’ user interfaces International Journal of Human-Computer Studies pp. 103627, (2025). doi: https://doi.org/10.1016/j.ijhcs.2025.103627 |
 |
|
|
|
 |
J039 |
VIVA: Virtual Healthcare Interactions Using Visual Analytics, With Controllability Through Configuration IEEE Transactions on Visualization and Computer Graphics pp. 1-18, (2025). doi: 10.1109/TVCG.2025.3599458 |
|
|
|
|
 |
J038 |
HAXplorer: Interactive visual exploration of hierarchical item and attribute spaces Computers & Graphics pp. 104233, (2025). doi: https://doi.org/10.1016/j.cag.2025.104233 |
|
|
|
|
 |
J037 |
Scalable Class-Centric Visual Interactive Labeling Computers & Graphics pp. 104240, (2025). doi: https://doi.org/10.1016/j.cag.2025.104240 |
|
|
|
|
 |
J036 |
Refining Established Practices for Research Question Definition to Foster Interdisciplinary Research Skills in a Digital Age: Consensus Study With Nominal Group Technique JMIR Medical Education pp. e56369, (2025). doi: 10.2196/56369 |
|
|
|
|
 |
J035 |
DaedalusData: Exploration, Knowledge Externalization and Labeling of Particles in Medical Manufacturing – A Design Study IEEE Transactions on Visualization and Computer Graphics pp. 1-11, (2024). doi: 10.1109/TVCG.2024.3456329 |
|
|
|
|
 |
J034 |
MS Pattern Explorer: interactive visual exploration of temporal activity patterns for multiple sclerosis Journal of the American Medical Informatics Association pp. 2496-2506, (2024). doi: 10.1093/jamia/ocae230 |
|
|
|
|
 |
J033 |
IVESA - Visual Analysis of Time-Stamped Event Sequences IEEE Transactions on Visualization and Computer Graphics (2024). doi: 10.1109/TVCG.2024.3382760 |
|
|
|
|
 |
J032 |
From wearable sensor data to digital biomarker development: ten lessons learned and a framework proposal npj Digital Medicine (2024). doi: 10.1038/S41746-024-01151-3 |
|
|
|
|
 |
J031 |
ManuKnowVis: How to Support Different User Groups in Contextualizing and Leveraging Knowledge Repositories IEEE Transactions on Visualization and Computer Graphics pp. 1-13, (2023). doi: 10.1109/TVCG.2023.3279857 |
|
|
|
|
 |
J030 |
LFPeers: Temporal Similarity Search and Result Exploration Computers & Graphics (2023). doi: https://doi.org/10.1016/j.cag.2023.06.009 |
|
|
|
|
 |
J029 |
How applicable are attribute-based approaches for human-centered ranking creation? Computers & Graphics pp. 45-58, (2023). doi: https://doi.org/10.1016/j.cag.2023.05.004 |
|
|
|
|
 |
J028 |
Erfahrungen aus der BarKA-MS-Studie zum Einsatz von Fitnesstrackern in der stationären Neurorehabilitation Psychiatrie & Neurologie (2022). |
|
|
|
|
 |
J027 |
Visualizing Graph Neural Networks with CorGIE: Corresponding a Graph to Its Embedding IEEE Transactions on Visualization and Computer Graphics pp. 2500-2516, (2022). doi: 10.1109/TVCG.2022.3148197 |
 |
|
|
|
 |
J026 |
ManEx: The Visual Analysis of Measurements for the Assessment of Errors in Electrical Engines IEEE Computer Graphics and Applications pp. 68-80, (2022). doi: 10.1109/MCG.2022.3155306 |
|
|
|
|
 |
J025 |
IRVINE: A Design Study on Analyzing Correlation Patterns of Electrical Engines IEEE Transactions on Visualization and Computer Graphics (TVCG) pp. 11-21, (2022). doi: 10.1109/TVCG.2021.3114797 |
|
|
|
|
 |
J024 |
QuestionComb: A Gamification Approach for the Visual Explanation of Linguistic Phenomena through Interactive Labeling ACM Transactions on Interactive Intelligent Systems (TiiS) pp. 1-38, (2021). doi: 10.1145/3429448 |
|
|
|
|
 |
J023 |
Co-adaptive visual data analysis and guidance processes Computers & Graphics (2021). doi: https://doi.org/10.1016/j.cag.2021.06.016 |
|
|
|
|
 |
J022 |
ProSeCo: Visual analysis of class separation measures and dataset characteristics Computers & Graphics pp. 48-60, (2021). doi: https://doi.org/10.1016/j.cag.2021.03.004 |
|
|
|
|
 |
J021 |
A Taxonomy of Property Measures to Unify Active Learning and Human-centered Approaches to Data Labeling ACM Transactions on Interactive Intelligent Systems (TiiS) (2021). doi: 10.1145/3439333 |
|
|
|
|
 |
J020 |
The Effect of Alignment on Peoples Ability to Judge Event Sequence Similarity IEEE Transactions on Visualization and Computer Graphics pp. 1-1, (2021). doi: 10.1109/TVCG.2021.3050497 |
|
|
|
|
 |
J019 |
Interactive Visual Labelling versus Active Learning: An Experimental Comparison Frontiers of Information Technology & Electronic Engineering (FITEE) pp. 524-535, (2020). doi: 10.1631/FITEE.1900549 |
|
|
|
|
 |
J018 |
ConfusionFlow: A model-agnostic visualization for temporal analysis of classifier confusion IEEE Transactions on Visualization and Computer Graphics (2020). |
|
|
|
 |
 |
J017 |
Visual-Interactive Preprocessing of Multivariate Time Series Data Computer Graphics Forum (CGF) pp. 401-412, (2019). doi: 10.1111/cgf.13698 |
|
|
|
|
 |
J016 |
Interactive Labelling of a Multivariate Dataset for Supervised Machine Learning Using Linked Visualisations, Clustering, and Active Learning Visual Informatics pp. 9-17, (2019). doi: 10.1016/j.visinf.2019.03.002 |
|
|
|
|
 |
J015 |
Towards User-Centered Active Learning Algorithms Computer Graphics Forum (CGF) pp. 121-132, (2018). doi: 10.1111/cgf.13406 |
|
|
|
|
 |
J014 |
SOMFlow: Guided Exploratory Cluster Analysis with Self-Organizing Maps and Analytic Provenance IEEE Transactions on Visualization and Computer Graphics (TVCG) pp. 120-130, (2018). doi: 10.1109/TVCG.2017.2744805 |
|
|
|
|
 |
J013 |
Using dashboard networks to visualize multiple patient histories: a design study on post-operative prostate cancer IEEE Transactions on Visualization and Computer Graphics (TVCG) pp. 1615-1628, (2018). doi: 10.1109/TVCG.2018.2803829 |
|
|
|
|
 |
J012 |
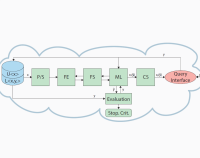
VIAL: a unified process for visual interactive labeling The Visual Computer (TVCJ) pp. 1189-1207, (2018). doi: 10.1007/s00371-018-1500-3 |
|
|
|
|
 |
J011 |
Comparing Visual-Interactive Labeling with Active Learning: An Experimental Study IEEE Transactions on Visualization and Computer Graphics (TCVG) pp. 298-308, (2018). doi: 10.1109/TVCG.2017.2744818 |
|
|
|
|
 |
J010 |
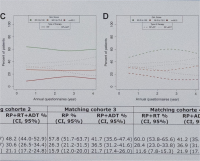
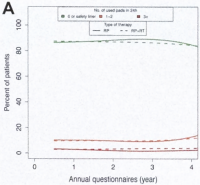
Functional Outcomes and Quality of Life After Radical Prostatectomy Only Versus a Combination of Prostatectomy with Radiation and Hormonal Therapy European Urology pp. 330-336, (2017). doi: https://doi.org/10.1016/j.eururo.2016.11.015 |
|
|
|
|
 |
J009 |
Toxicity in a Multimodality Approach of Radical Prostatectomy with Radiation and Hormonal Therapy Journal of Clinical Oncology (JCO) pp. 107, (2016). |
|
|
|
|
 |
J008 |
A Visual-Interactive System for Prostate Cancer Cohort Analysis Computer Graphics and Applications (CG&A), IEEE pp. 44-55, (2015). doi: 10.1109/MCG.2015.49 |
|
|
|
|
 |
J007 |
VisInfo: a digital library system for time series research data based on exploratory search—a user-centered design approach International Journal on Digital Libraries (IJoDL), Springer pp. 37-59, (2015). doi: 10.1007/s00799-014-0134-y |
|
|
|
|
 |
J006 |
Visual-interactive Exploration of Interesting Multivariate Relations in Mixed Research Data Sets Computer Graphics Forum (CGF) pp. 291-300, (2014). doi: 10.1111/cgf.12385 |
|
|
|
|
 |
J005 |
Visual Analysis of Time-Series Similarities for Anomaly Detection in Sensor Networks Computer Graphics Forum (CGF) pp. 401-410, (2014). doi: 10.1111/cgf.12396 |
|
|
|
|
 |
J004 |
MotionExplorer: Exploratory Search in Human Motion Capture Data Based on Hierarchical Aggregation IEEE Transactions on Visualization and Computer Graphics (TVCG) pp. 2257-2266, (2013). doi: 10.1109/TVCG.2013.178 |
|
|
|
|
 |
J003 |
Assisted Descriptor Selection Based on Visual Comparative Data Analysis Computer Graphics Forum (CGF) pp. 891-900, (2011). doi: 10.1111/j.1467-8659.2011.01938.x |
|
|
|
|
 |
J002 |
A visual digital library approach for time-oriented scientific primary data International Journal of Digital Libraries (IJoDL), ECDL 2010 Special Issue, Springer pp. 111-123, (2011). doi: 10.1007/s00799-011-0072-x |
|
|
|
|
 |
J001 |
Visual Cluster Analysis of Trajectory Data with Interactive Kohonen Maps Information Visualization, Palgrave Macmillan pp. 14-29, (2009). doi: 10.1057/ivs.2008.29 |
|
|
|
|
Peer-reviewed Full Papers
 |
P029 |
Val-LLM: A Visual Analytics Approach for the Critical Validation of LLM-Generated Tabular Data Vision, Modeling, and Visualization, (VMV), Eurographics Association (2025). doi: 10.2312/vmv.20251235 |
|
|
|
|
 |
P028 |
Towards Personal Explanations for Recommender Systems: A Study on the Impact of Familiarity and Urgency Adjunct Proceedings of the 2024 Nordic Conference on Human-Computer Interaction (NordiCHI), Association for Computing Machinery (2024). doi: 10.1145/3677045.3685430 |
|
|
|
|
 |
P027 |
"It s like a glimpse into the future": Exploring the Role of Blood Glucose Prediction Technologies for Type 1 Diabetes Self-Management CHI Conference on Human Factors in Computing Systems (CHI), Association for Computing Machinery (2024). doi: 10.1145/3613904.3642234 |
|
|
|
|
 |
P026 |
LayoutExOmizer: Interactive Exploration and Optimization of 2D Data Layouts Vision, Modeling, and Visualization, (VMV), Eurographics Association pp. 99-107, (2021). doi: 10.2312/vmv.20211376 |
|
|
|
|
 |
P025 |
Visualizing Time Series Consistency for Feature Selection Conference in Central Europe on Computer Graphics, Visualization and Computer Vision, Vaclav Skala-UNION Agency (2019). doi: http://hdl.handle.net/11025/35593 |
|
|
|
|
 |
P024 |
Approaches and Challenges in the Visual-Interactive Comparison of Human Motion Data Conference on Information Visualization Theory and Applications (IVAPP, VISIGRAPP) pp. 217-224, (2017). doi: 10.5220/0006127502170224 |
|
|
|
|
 |
P023 |
Visual-Interactive Similarity Search for Complex Objects by Example of Soccer Player Analysis Conference on Computer Vision, Imaging and Computer Graphics Theory and Applications (IVAPP, VISIGRAPP) (3) pp. 75-87, (2017). doi: 10.5220/0006116400750087 |
|
|
|
|
 |
P022 |
Visual-Interactive Semi-Supervised Labeling of Human Motion Capture Data Visualization and Data Analysis (VDA 2017) (2017). doi: https://doi.org/10.2352/ISSN.2470-1173.2017.1.VDA-387 |
|
|
|
|
 |
P021 |
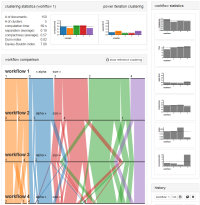
Visual Interactive Creation and Validation of Text Clustering Workflows to Explore Document Collections Electronic Imaging pp. 46-57, (2017). doi: doi:10.2352/ISSN.2470-1173.2017.1.VDA-388 |
|
|
|
|
 |
P020 |
Exploratory search in time-oriented primary data Ausgezeichnete Informatikdissertationen 2015 (D-16), Gesellschaft für Informatik (GI) pp. 11-20, (2016). |
|
|
|
|
 |
P019 |
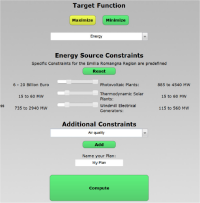
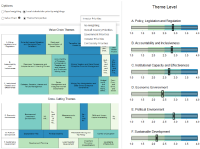
Supporting Collaborative Political Decision Making: An Interactive Policy Process Visualization System Symposium on Visual Information Communication and Interaction, ACM pp. 104-111, (2016). doi: 10.1145/2968220.2968223 |
|
|
|
|
 |
P018 |
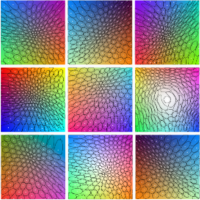
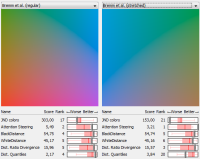
A survey and task-based quality assessment of static 2D colormaps Electronic Imaging, SPIE Conference on Visualization and Data Analysis pp. 93970M-93970M-16, (2015). doi: 10.1117/12.2079841 |
|
|
|
|
 |
P017 |
FuryExplorer: Visual-Interactive Exploration of Horse Motion Capture Data Electronic Imaging, SPIE Conference on Visualization and Data Analysis (2015). doi: doi:10.1117/12.2080001 |
|
|
|
|
 |
P016 |
Explorative Analysis of 2D Color Maps Proceedings of WSCG (23), Eurographics Assciation, Vaclav Skala - Union Agency pp. 151-160, (2015). |
|
|
|
|
 |
P015 |
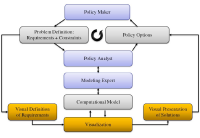
Visual Access to an Agent-based Simulation Model to Support Political Decision Making Conference on Knowledge Technologies and Data-driven Business, ACM pp. 1-16, (2014). doi: 10.1145/2637748.2638410 |
|
|
|
|
 |
P014 |
Combining Computational Models and Interactive Visualization to Support Rational Decision Making Advances in Visual Computing (8887), Springer International Publishing pp. 345-356, (2014). doi: 10.1007/978-3-319-14249-4_33 |
|
|
|
|
 |
P013 |
A Survey of Direction-preserving Layout Strategies Spring Conference on Computer Graphics, ACM pp. 21-28, (2014). doi: 10.1145/2643188.2643189 |
|
|
|
|
 |
P012 |
User-Based Visual-Interactive Similarity Definition for Mixed Data Objects-Concept and First Implementation Proceedings of WSCG (22), Eurographics Assciation, Vaclav Skala - Union Agency pp. 329-338, (2014). |
|
|
|
|
 |
P011 |
Bridging Knowledge Gaps in Policy Analysis with Information Visualization Conference on Electronic Government (EGOV/ePart Ongoing Research) (221), GI pp. 92-103, (2013). |
|
|
|
|
 |
P010 |
Adaptive Semantic Visualization for Bibliographic Entries Advances in Visual Computing (8034), Springer Berlin Heidelberg pp. 13-24, (2013). doi: 10.1007/978-3-642-41939-3_2 |
|
|
|
|
 |
P009 |
Visual Access to Optimization Problems in Strategic Environmental Assessment Advances in Visual Computing (8034), Springer Berlin Heidelberg pp. 361-372, (2013). doi: 10.1007/978-3-642-41939-3_35 |
|
|
|
|
 |
P008 |
Content-based layouts for exploratory metadata search in scientific research data ACM/IEEE-CS Joint Conference on Digital Libraries, ACM pp. 139-148, (2012). doi: 10.1145/2232817.2232844 |
|
|
|
|
 |
P007 |
Visual-Interactive Preprocessing of Time Series Data SIGRAD, Swedish Chapter of Eurographics (81), Linköping University Electronic Press pp. 39-48, (2012). |
|
|
|
|
 |
P006 |
Guided Discovery of Interesting Relationships Between Time Series Clusters and Metadata Properties International Conference on Knowledge Management and Knowledge Technologies, ACM pp. 1-22, (2012). doi: 10.1145/2362456.2362485 |
|
|
|
|
 |
P005 |
TimeSeriesPaths: Projection-Based Explorative Analysis of Multivariate Time Series Data Journal of WSCG pp. 97-106, (2012). |
|
|
|
|
 |
P004 |
Retrieval and Exploratory Search in Multivariate Research Data Repositories Using Regressional Features ACM/IEEE Joint Conference on Digital Libraries, ACM pp. 363-372, (2011). doi: 10.1145/1998076.1998144 |
|
|
|
|
 |
P003 |
Multiscale visual quality assessment for cluster analysis with Self-Organizing Maps Electronic Imaging, SPIE Conference on Visualization and Data Analysis pp. 1-78680, (2011). doi: 10.1117/12.872545 |
|
|
|
|
 |
P002 |
A Visual Digital Library Approach for Time-Oriented Research Data European Conference on Digital Libraries (6273), Springer pp. 352-363, (2010). doi: 10.1007/978-3-642-15464-5_35 |
|
|
|
|
 |
P001 |
Visual Cluster Analysis of Trajectory Data with Interactive Kohonen Maps IEEE Symposium on Visual Analytics Science and Technology, IEEE Computer Society pp. 3-10, (2008). doi: 10.1109/VAST.2008.4677350 |
|
|
|
|
Peer-reviewed Workshop Publications
 |
W042 |
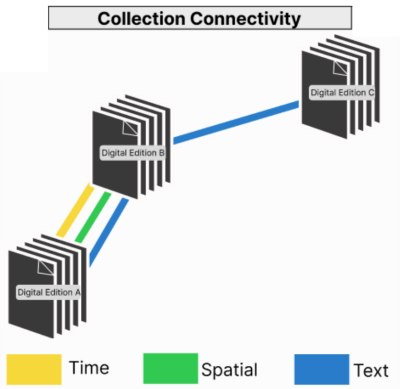
Exploring Multi-Faceted Connections Between Heterogeneous Digital Scholarly Editions: A Data-First Design Study IEEE VIS Workshop on Visualization for the Digital Humanities (VIS4DH), IEEE (2025). |
|
|
|
|
 |
W041 |
HUMMUS: A Human-Centered Approach to Sequential Recommendation Explainability through Data Humanism ACM RecSys Workshop on Music Recommender Systems (MuRS), ACM (2025). |
|
|
|
|
 |
W040 |
Grand Challenge: Mediating Between Confirmatory and Exploratory Research Cultures in Health Sciences and Visual Analytics IEEE VIS Workshop on Visual Analytics in Healthcare (Grand Challenge Position) (2025). |
|
|
|
|
 |
W039 |
The Human-Data-Model Interaction Canvas for Visual Analytics EuroVis Workshop on Visual Analytics (EuroVA), The Eurographics Association (2025). doi: 10.2312/eurova.20251096 |
|
|
|
|
 |
W038 |
A Design Space for the Critical Validation of LLM-Generated Tabular Data EuroVis Workshop on Visual Analytics (EuroVA), The Eurographics Association (2025). doi: 10.2312/eurova.20251101 |
|
|
|
|
 |
W037 |
SwissText 2024 Shared Task: Automatic Classification of the United Nations Sustainable Development Goals (SDGs) and Their Targets in English Scientific Abstracts Swiss Text Analytics Conference, Association for Computational Linguistics pp. 193-197, (2024). |
|
|
|
|
 |
W036 |
Visualization and Automation in Data Science: Exploring the Paradox of Humans-in-the-Loop IEEE VIS: Visualization in Data Science Symposium (VDS), IEEE (2024). doi: 10.1109/VDS63897.2024.00005 |
|
|
|
|
 |
W035 |
ScrollyPOI: A Narrative-Driven Interactive Recommender System for Points-of-Interest Exploration and Explainability ACM Conference on User Modeling, Adaptation and Personalization (UMAP), Association for Computing Machinery pp. 292–304, (2024). doi: 10.1145/3631700.3665183 |
|
|
|
|
 |
W034 |
Tag-Xplore: Interactive Exploration of Annotation Practices in Digital Editions EuroVis Workshop on Visual Analytics (EuroVA), The Eurographics Association (2024). doi: 10.2312/eurova.20241115 |
|
|
|
|
 |
W033 |
Human-Based and Automatic Feature Ideation for Time Series Data: A Comparative Study EuroVis Workshop on Visual Analytics (EuroVA), The Eurographics Association (2023). doi: 10.2312/eurova.20231089 |
|
|
|
|
 |
W032 |
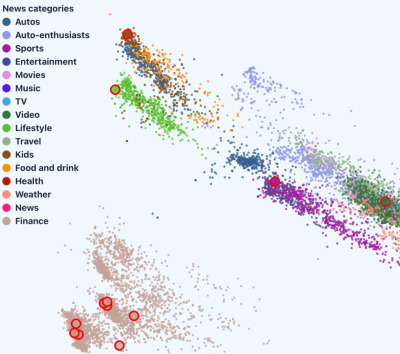
Why am I reading this? Explaining Personalized News Recommender Systems EuroVis Workshop on Visual Analytics (EuroVA), The Eurographics Association (2023). doi: 10.2312/eurova.20231099 |
|
|
|
|
 |
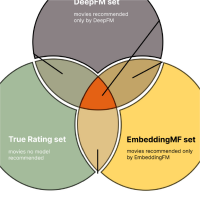
W031 |
What Shall We Watch Tonight? Why Sometimes Your Favourite Streaming Service Just Cannot Manage to Recommend Anything Interesting IEEE VIS Workshop on Visualization for AI Explainability (2022). |
|
|
|
|
 |
W030 |
A Data-Centric Methodology and Task Typology for Time-Stamped Event Sequences VIS Workshop on Evaluation and Beyond — Methodological Approaches for Visualization (BELIV), IEEE pp. 66-76, (2022). doi: 10.1109/BELIV57783.2022.00012 |
|
|
|
|
 |
W029 |
RankASco: A Visual Analytics Approach to Leverage Attribute-Based User Preferences for Item Rankings EuroVis Workshop on Visual Analytics (EuroVA), The Eurographics Association (2022). doi: 10.2312/eurova.20221072 |
|
|
|
|
 |
W028 |
Interactive Visual Explanation of Incremental Data Labeling EuroVis Workshop on Visual Analytics (EuroVA), The Eurographics Association (2022). doi: 10.2312/eurova.20221073 |
|
|
|
|
 |
W027 |
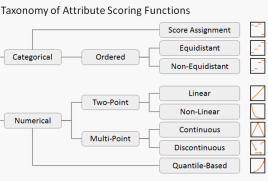
A Taxonomy of Attribute Scoring Functions EuroVis Workshop on Visual Analytics (EuroVA), The Eurographics Association (2021). doi: 10.2312/eurova.20211095 |
|
|
|
|
 |
W026 |
LFPeers: Temporal Similarity Search in Covid-19 Data EuroVis Workshop on Visual Analytics (EuroVA), The Eurographics Association (2021). doi: 10.2312/eurova.20211098 |
|
|
|
|
 |
W025 |
SepEx: Visual Analysis of Class Separation Measures EuroVis Workshop on Visual Analytics (EuroVA), The Eurographics Association (2020). doi: 10.2312/eurova.20201079 |
|
|
|
|
 |
W024 |
Learning and Teaching in Co-Adaptive Guidance for Mixed-Initiative Visual Analytics EuroVis Workshop on Visual Analytics (EuroVA), The Eurographics Association (2020). doi: 10.2312/eurova.20201088 |
|
|
|
|
 |
W023 |
Visual Analysis of Degree-of-Interest Functions to Support Selection Strategies for Instance Labeling EuroVis Workshop on Visual Analytics (EuroVA), The Eurographics Association (2019). doi: https://doi.org/10.2312/eurova.20191116 |
|
|
|
|
 |
W022 |
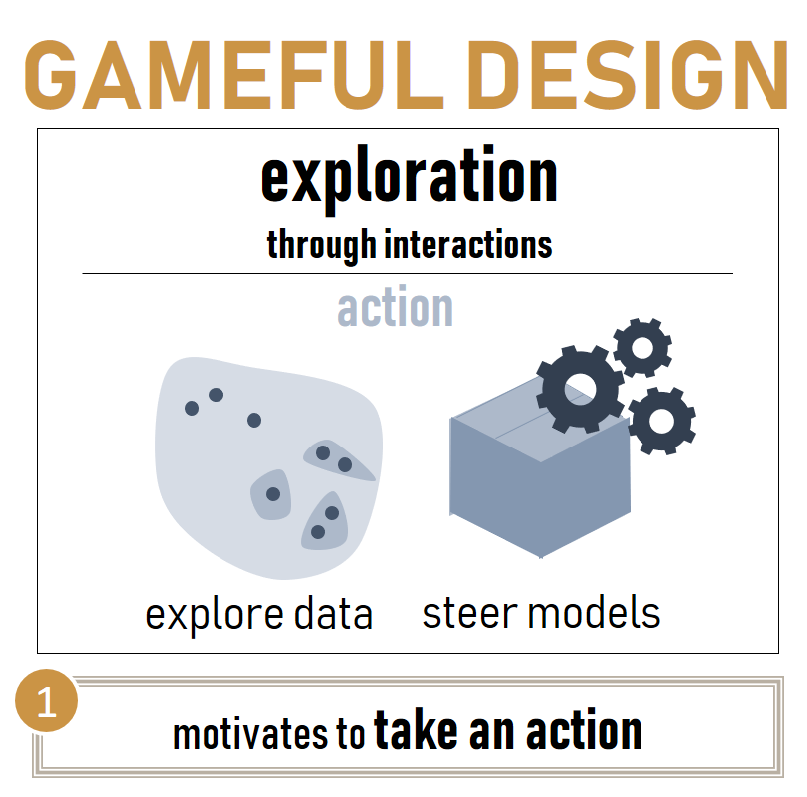
Shall we play?—Extending the Visual Analytics Design Space through Gameful Design Concepts MLUI 2019: Machine Learning from User Interactions for Visualization and Analytics, IEEE VIS 2019 workshop (2019). doi: 10.1109/MLUI52769.2019.10075563 |
|
|
|
|
 |
W021 |
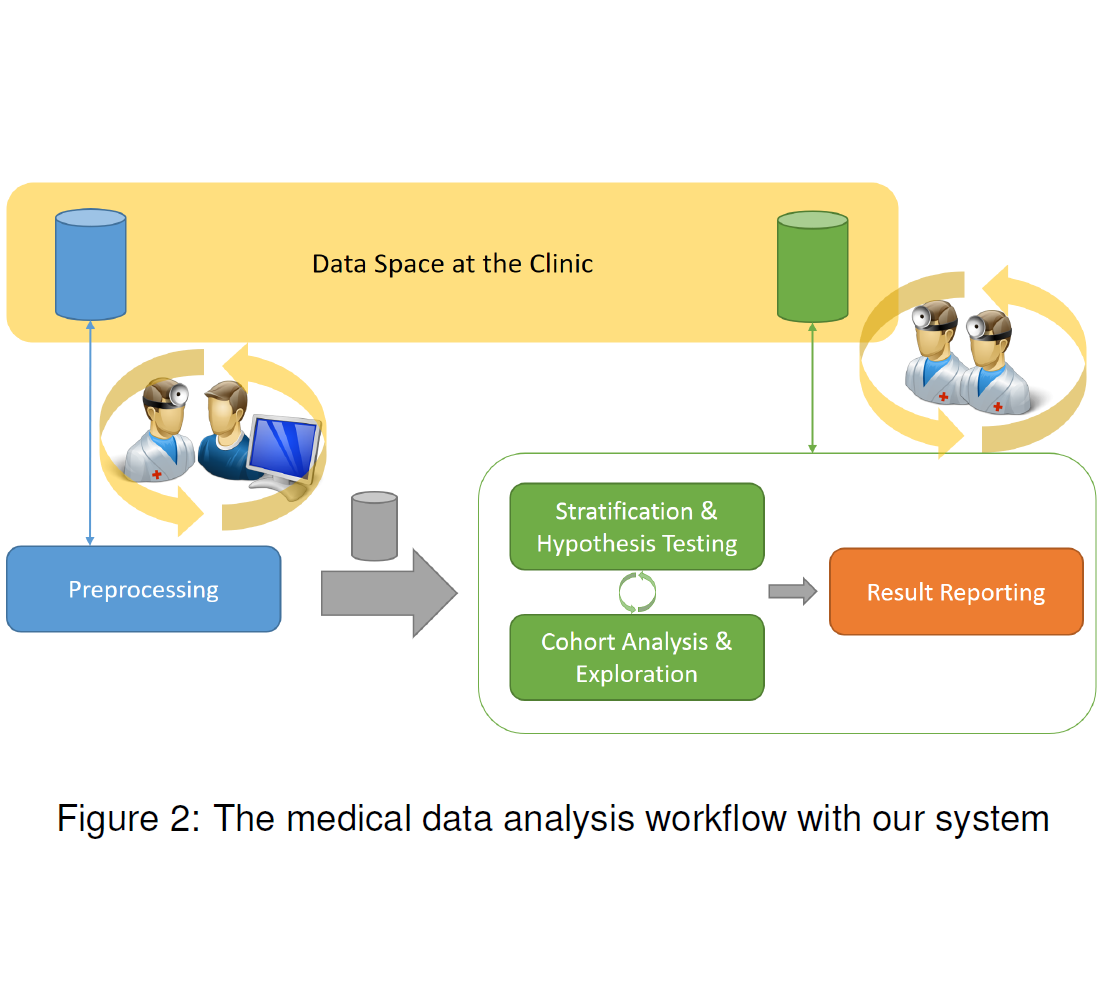
Self-Service Data Preprocessing and Cohort Analysis for Medical Researchers IEEE Workshop on Visual Analytics in Healthcare (VAHC) pp. 17-24, (2019). doi: 10.1109/VAHC47919.2019.8945040 |
|
|
|
|
 |
W020 |
mVis in the Wild: Pre-Study of an Interactive Visual Machine Learning System for Labelling IEEE VIS 2019 Workshop on Evaluation of Interactive Visual Machine Learning Systems (2019). |
|
|
|
|
 |
W019 |
Quantifying Uncertainty in Multivariate Time Series Pre-Processing EuroVis Workshop on Visual Analytics (EuroVA), The Eurographics Association (2019). doi: 10.2312/eurova.20191121 |
|
|
|
|
 |
W018 |
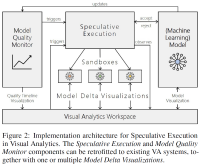
Speculative Execution for Guided Visual Analytics VIS Workshop on Machine Learning from User Interaction for Visualization and Analytics, IEEE (2018). doi: 10.1109/MLUI52768.2018.10075559 |
|
|
|
|
 |
W017 |
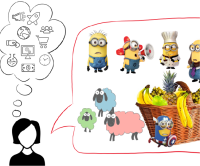
Minions, Sheep, and Fruits: Metaphorical Narratives to Explain Artificial Intelligence and Build Trust IEEE VIS Workshop on Visualization for AI Explainability (2018). doi: urn:nbn:de:bsz:352-2-1q5oi0xg28s59 |
|
|
|
|
 |
W016 |
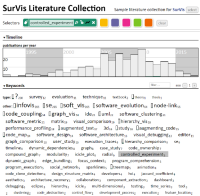
Computer-supported Interactive Assignment of Keywords for Literature Collections IEEE VIS Workshop on Machine Learning from User Interaction for Visualization and Analytics, IEEE (2018). |
|
|
|
|
 |
W015 |
Lowering the Barrier for Successful Replication and Evaluation IEEE VIS Workshop on Evaluation and Beyond - Methodological Approaches for Visualizations (BELIV), IEEE (2018). |
|
|
|
|
 |
W014 |
Personalized Visual-Interactive Music Classification EuroVis Workshop on Visual Analytics (EuroVA), The Eurographics Association (2018). doi: 10.2312/eurova.20181109 |
|
|
|
|
 |
W013 |
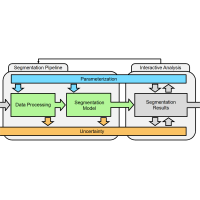
Combining the Automated Segmentation and Visual Analysis of Multivariate Time Series EuroVis Workshop on Visual Analytics (EuroVA), The Eurographics Association (2018). doi: 10.2312/eurova.20181112 |
|
|
|
|
 |
W012 |
A Unified Process for Visual-Interactive Labeling EuroVis Workshop on Visual Analytics (EuroVA), The Eurographics Association (2017). doi: 10.2312/eurova.20171123 |
|
|
|
|
 |
W011 |
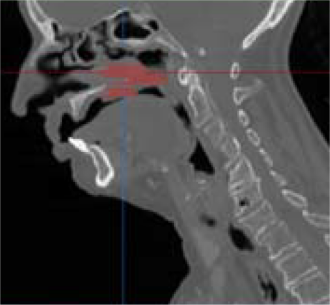
Visual analytics for radiomics: Combining medical imaging with patient data for clinical research IEEE Workshop on Visual Analytics in Healthcare (VAHC), IEEE pp. 84-91, (2017). doi: 10.1109/VAHC.2017.8387545 |
|
|
|
|
 |
W010 |
Combining Cluster and Outlier Analysis with Visual Analytics EuroVis Workshop on Visual Analytics (EuroVA), The Eurographics Association (2017). doi: 10.2312/eurova.20171114 |
|
|
|
|
 |
W009 |
Structuring the Strategies for Integrating Visualization into Automated Modeling Techniques for Visual Analytics IEEE VIS Workshop on Creation, Curation, Critique and Conditioning of Principles and Guidelines in Visualization (C4PGV) (2016). |
|
|
|
|
 |
W008 |
Visual-Interactive Segmentation of Multivariate Time Series EuroVis Workshop on Visual Analytics (EuroVA), The Eurographics Association (2016). doi: 10.2312/eurova.20161121 |
|
|
|
|
 |
W007 |
Visual-Interactive Exploration of Relations Between Time-Oriented Data and Multivariate Data EuroVis Workshop on Visual Analytics (EuroVA), The Eurographics Association (2016). doi: 10.2312/eurova.20161124 |
|
|
|
|
 |
W006 |
Methods and a research agenda for the evaluation of event sequence visualization techniques IEEE VIS 2016 Workshop on Temporal \& Sequential Event Analysis. (2016). doi: https://eprints.whiterose.ac.uk/id/eprint/106008/ |
|
|
|
|
 |
W005 |
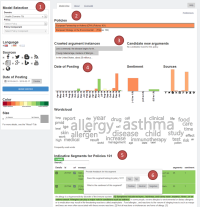
Visual-Interactive Text Analysis to Support Political Decision Making - From Sentiments to Arguments to Policies EuroVis Workshop on Visual Analytics (EuroVA), The Eurographics Association (2015). doi: 10.2312/eurova.20151101 |
|
|
|
|
 |
W004 |
Visual Analysis of Relations in Attributed Time-Series Data EuroVis Workshop on Visual Analytics (EuroVA), The Eurographics Association (2015). doi: 10.2312/eurova.20151105 |
|
|
|
|
 |
W003 |
A Visual Active Learning System for the Assessment of Patient Well-being in Prostate Cancer Research IEEE VIS Workshop on Visual Analytics in Healthcare, ACM pp. 1-8, (2015). doi: 10.1145/2836034.2836035 |
|
|
|
|
 |
W002 |
A Visual-interactive System for Prostate Cancer Stratifications IEEE Vis Workshop on Visualizing Electronic Health Record Data (EHRVis), IEEE Computer Society (2014). |
|
|
|
|
 |
W001 |
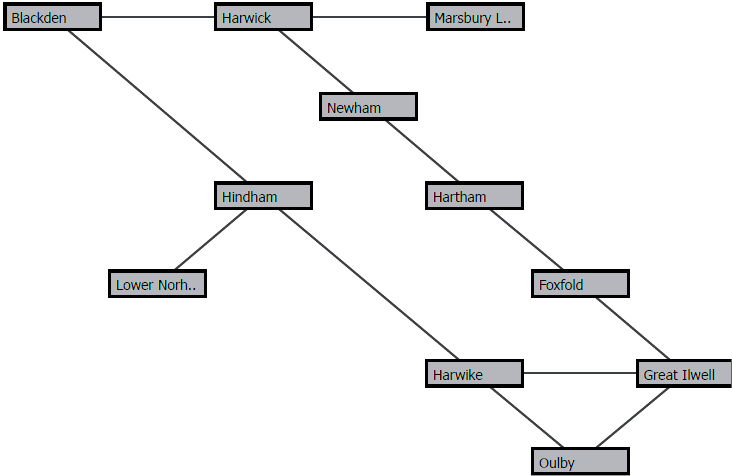
Smart Query Definition for Content-Based Search in Large Sets of Graphs International Symposium on Visual Analytics Science and Technology, Eurographics Association pp. 7-12, (2010). doi: /10.2312/PE/EuroVAST/EuroVAST10/007-012 |
|
|
|
Peer-reviewed Short Papers
 |
S011 |
Future Challenges and Unsolved Problems in Health Visualization EuroVis 2025 - Panels and Tutorials, The Eurographics Association (2025). doi: 10.2312/evt.20251119 |
|
|
|
|
 |
S010 |
Data Humanism Decoded: A Characterization of its Principles to Bridge Data Visualization Researchers and Practitioners IEEE Visualization Conference - Short Papers, IEEE (2025). doi: https://doi.org/10.48550/arXiv.2509.00440 |
|
|
|
|
 |
S009 |
Incident Cards: A Tool for Documenting and Reviewing Experiences with Chronic Conditions Proceedings of the Extended Abstracts of the CHI Conference on Human Factors in Computing Systems, Association for Computing Machinery (2025). doi: 10.1145/3706599.3720194 |
|
|
|
|
 |
S008 |
Reflections on interactive visualization of electronic health records: past, present, future Journal of the American Medical Informatics Association pp. 2423-2428, (2024). doi: 10.1093/jamia/ocae249 |
|
|
|
|
 |
S007 |
The Future of Interactive Data Analysis and Visualization EuroVis 2023 - Panel, The Eurographics Association (2023). doi: 10.2312/evt.20231119 |
|
|
|
|
 |
S006 |
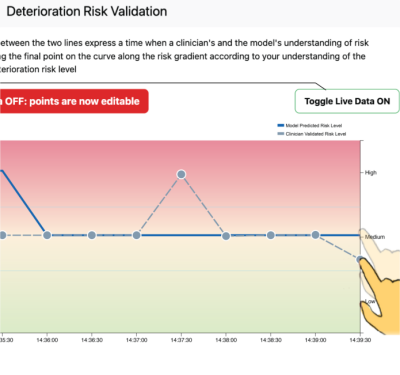
RiskFix: Supporting Expert Validation of Predictive Timeseries Models in High-Intensity Settings EuroVis 2023 - Short Papers, The Eurographics Association (2023). doi: 10.2312/evs.20231036 |
|
|
|
|
 |
S005 |
Does the Layout Really Matter? A Study on Visual Model Accuracy Estimation IEEE Visualization Conference - Short Papers, IEEE pp. 61-65, (2021). doi: 10.1109/VIS49827.2021.9623326 |
|
|
|
|
 |
S004 |
Learning from the Best - Visual Analysis of a Quasi-Optimal Data Labeling Strategy EuroVis 2018 - Short Papers, The Eurographics Association (2018). doi: 10.2312/eurovisshort.20181085 |
|
|
|
|
 |
S003 |
Visual Access to Performance Indicators in the Mining Sector EuroVis 2017 - Short Papers, The Eurographics Association (2017). doi: 10.2312/eurovisshort.20171150 |
|
|
|
|
 |
S002 |
Visual Analytics of Work Behavior Data - Insights on Individual Differences Eurographics Conference on Visualization (EuroVis) - Short Papers, The Eurographics Association (2015). doi: 10.2312/eurovisshort.20151129 |
|
|
|
|
 |
S001 |
Revisiting Perceptually Optimized Color Mapping for High-Dimensional Data Analysis EuroVis - Short Papers, The Eurographics Association (2014). doi: 10.2312/eurovisshort.20141163 |
|
|
|
Posters
 |
O015 |
PRISM: From Individual Preferences to Group Consensus through Conversational AI-Mediated and Visual Explanations ACM Conference on Recommender Systems, Association for Computing Machinery pp. 1343–1345, (2025). doi: 10.1145/3705328.3759340 |
|
|
|
|
 |
O014 |
Blooming Beats: An Interactive Music Recommender System Grounded in TRACE Principles and Data Humanism ACM Conference on Recommender Systems (RecSys), Association for Computing Machinery pp. 1331–1333, (2025). doi: 10.1145/3705328.3759337 |
|
|
|
|
 |
O013 |
ORD-Xplore: Bridging Open Research Data Collections through Modality Abstractions EuroVis 2023 - Posters, The Eurographics Association (2023). doi: 10.2312/evp.20231065 |
|
|
|
|
 |
O012 |
Interaction Tasks for Explainable Recommender Systems EuroVis 2023 - Posters, The Eurographics Association (2023). doi: 10.2312/evp.20231062 |
|
|
|
|
 |
O011 |
A Design Space for Explainable Ranking and Ranking Models EuroVis 2022 - Posters, The Eurographics Association (2022). doi: 10.2312/evp.20221114 |
|
|
|
|
 |
O010 |
Toxicity in a Multimodality Approach of Radical Prostatectomy with Radiation and Hormonal Therapy Genitourinary Cancers Symposium (2016). doi: 10.1200/jco.2016.34.2_suppl.107 |
|
|
|
|
 |
O009 |
Towards Combining Attribute-based and Time Series-based Visual Querying EuroVis 2016 - Posters, The Eurographics Association (2016). doi: 10.2312/eurp.20161145 |
|
|
|
|
 |
O008 |
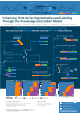
Enhancing Time Series Segmentation and Labeling Through the Knowledge Generation Model Eurographics Conference on Visualization (EuroVis) - Poster, The Eurographics Association (2015). |
|
|
|
|
 |
O007 |
Towards a User-Defined Visual-Interactive Definition of Similarity Functions for Mixed Data IEEE Symposium on Visual Analytics Science and Technology (Poster Paper) (2014). doi: 10.1109/VAST.2014.7042503 |
|
|
|
|
 |
O006 |
Towards a Tighter Coupling of Visualization and Public Policy Making Proc. IEEE Symposium on Visual Analytics Science and Technology (Poster Paper) (2014). doi: 10.1109/VAST.2014.7042525 |
|
|
|
|
 |
O005 |
Adopting Mental Similarity Notions of Categorical Data Objects to Algorithmic Similarity Functions Vision, Modelling and Visualization (VMV) (2014). doi: 10.13140/RG.2.2.19683.25129 |
|
|
|
|
 |
O004 |
Interactive Multi-Criteria Optimization of 2D Color Maps Vision, Modelling and Visualization (VMV) (2014). doi: 10.13140/RG.2.2.34782.74560 |
|
|
|
|
 |
O003 |
Visual Exploration of Local Interest Points in Sets of Time Series Proceedings of IEEE Symposium on Visual Analytics Science and Technology (Poster Paper) (2012). doi: 10.1109/VAST.2012.6400534 |
|
|
|
|
 |
O002 |
Cluster Correspondence Views for Enhanced Analysis of SOM Displays IEEE Symposium on Visual Analytics Science and Technology pp. 217-218, (2010). doi: 10.1109/VAST.2010.5651676 |
|
|
|
|
 |
O001 |
Micro-Macro Views for Visual Trajectory Cluster Analysis Eurographics/IEEE Symposium on Visualization (2009). |
|
|
|
Data Sets (Open Access)
 |
D008 |
SwissText 2024 Shared Task: Automatic Classification of the United Nations Sustainable Development Goals (SDGs) and Their Targets in English Scientific Abstracts Swiss Text Analytics Conference, Association for Computational Linguistics pp. 193-197, (2024). doi: https://doi.org/10.5167/uzh-275614 |
|
|
|
|
 |
D007 |
100 Synthetic Datasets for the Analysis of Class Separation Measures Used in Publication - SepEx: Visual Analysis of Class Separation Measures (2020). |
|
|
|
|
 |
D006 |
30 years of synoptic observations from Neumayer Station with links to datasets PANGAEA - Data Publisher for Earth and Environmental Science (2014). doi: 10.1594/PANGAEA.150017 |
|
|
|
|
 |
D005 |
Reference list of 120 datasets from time series station Payerne used for exploratory search PANGAEA - Data Publisher for Earth and Environmental Science (2012). doi: doi:10.1594/PANGAEA.783598 |
|
|
|
|
 |
D004 |
Reference list of 265 sources used for the discovery of relationships between data clusters and metadata properties PANGAEA - Data Publisher for Earth and Environmental Science (2012). doi: doi:10.1594/PANGAEA.785666 |
|
|
|
|
 |
D003 |
Reference list of 269 sources used for exploratory search PANGAEA - Data Publisher for Earth and Environmental Science (2012). doi: 10.1594/PANGAEA.778638 |
|
|
|
|
 |
D002 |
Time-oriented earth observation measurements from the Baseline Surface Radiation Network (BSRN) in the years 1992 to 2012, reference list of 6813 datasets PANGAEA - Data Publisher for Earth and Environmental Science (2012). doi: doi:10.1594/PANGAEA.787726 |
|
|
|
|
 |
D001 |
Reference list of sources used for two experimental data files dataBSRN and dataMixed PANGAEA - Data Publisher for Earth and Environmental Science (2011). doi: doi:10.1594/PANGAEA.756307 |
|
|
|
|
Teaching
| Seminar | Interactive Visual Data Analysis | 3 ECTS | [Spring Term 2024] | |
| Seminar | Interactive Data Science in Digital Health | 3 ECTS | [Spring Term 2024] | |
| Lecture | Interactive Visual Data Analysis | 6 ECTS | [Fall Term 2023] | |
| Seminar | Visual Analytics | 3 ECTS | [Fall Term 2023] | |
| Supervision | Fundamentals of People Oriented Computing | 6 ECTS | [Fall Term 2023] | |
| Seminar | Interactive Visual Data Analysis | 3 ECTS | [Spring Term 2023] | |
| Seminar | Interactive Data Science in Digital Health | 3 ECTS | [Spring Term 2023] | |
| Lecture | Interactive Visual Data Analysis | 6 ECTS | [Fall Term 2022] | |
| Supervision | Fundamentals of People Oriented Computing | 6 ECTS | [Fall Term 2022] | |
| Seminar | Interactive Visual Data Analysis | 3 ECTS | [Spring Term 2022] | |
| Seminar | Interactive Data Science in Digital Health | 3 ECTS | [Spring Term 2022] | |
| Lecture | Introduction to Interactive Visual Data Analysis | 3 ECTS | [Fall Term 2021] | |
| Supervision | Fundamentals of People Oriented Computing | 6 ECTS | [Fall Term 2021] | |
| Seminar | Interactive Visual Data Analysis | 3 ECTS | [Spring Term 2021] | |
| Seminar | Creating Evidence in Digital and Mobile Health | 3 ECTS | [Spring Term 2021] | |
| Lecture Exercise | Information Visualization and Visual Analytics | L2+E2 | [WS 2018/19] | |
| Practical Course | Visual Computing Lab | P4 | [WS 2018/19] | |
| Lecture | User-Centered Design in Visual Computing | V2 | [SS 2018] | |
| Practical Course | Visual Computing Lab | P4 | [SS 2018] | |
| Practical Course | Advanced Visual Computing Lab | P4 | [SS 2018] | |
| Practical Course | Visual Computing Lab | P4 | [WS 2017/18] | |
| Lecture | User-Centered Design in Visual Computing | V2 | [SS 2017] | |
| Practical Course | Visual Computing Lab | P4 | [SS 2017] | |
| Practical Course | Advanced Visual Computing Lab | P4 | [SS 2017] | |
| Lecture Exercise | Information Visualization and Visual Analytics | L2+E2 | [WS 2016/17] | |
| Practical Course | Visual Computing Lab | P4 | [WS 2016/17] | |
| Practical Course | Visual Computing Lab | P4 | [SS 2016] | |
| Seminar | Visual Analytics: Interactive Visualization of very large amounts of data | S2 | [SS 2016] | |
| Practical Course | Visual Computing | P4 | [WS 2015/16] | |
| Practical Course | Programmierung eines graphischen Systems | P4 | [SS 2015] | |
| Practical Course | Fortgeschrittene Programmierung eines Graphischen Systems | P4 | [WS 2014/15] | |
| Seminar | Visual Analytics: Interaktive Visualisierung sehr großer Datenmengen | S2 | [SS 2014] | |
| Practical Course | Fortgeschrittene Programmierung eines Graphischen Systems | P4 | [WS 2013/14] | |
| Practical Course | Fortgeschrittene Programmierung eines Graphischen Systems | P4 | [SS 2013] | |
| Seminar | Visual Analytics: Interaktive Visualisierung sehr großer Datenmengen | S2 | [SS 2012] | |
| Practical Course | Fortgeschrittene Programmierung eines Graphischen Systems | P4 | [SS 2012] | |
| Lecture Exercise | Information Visualization and Visual Analytics | V4 | [WS 2011/12] | |
| Seminar | Visualisierung und interaktive Analyse naturwissenschaftlicher Daten | S2 | [WS 2011/12] | |
| Practical Course | Fortgeschrittene Programmierung eines Graphischen Systems | P4 | [WS 2011/12] | |
| Seminar | Visual Analytics: Interaktive Visualisierung sehr großer Datenmengen | S2 | [SS 2011] | |
| Practical Course | Fortgeschrittene Programmierung eines graphischen Systems | P4 | [SS 2011] | |
| Seminar | Visual Analytics: Interaktive Visualisierung sehr großer Datenmengen | S2 | [WS 2010/11] | |
| Practical Course | Programmierung eines graphischen Systems | P4 | [WS 2010/11] | |
Publication Gallery